
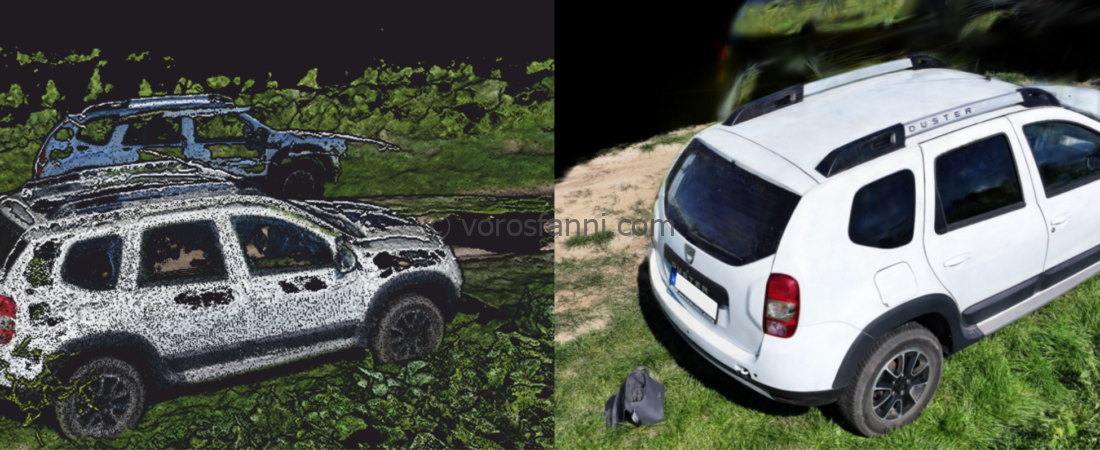
Good, good, Gaussian Splatting, but what is it, and why is it good?
When it comes to 3D data processing and visualization, two key concepts almost immediately come up: the point cloud and the mesh. A point cloud is an unstructured dataset consisting of millions of individual points. Each point has its own X, Y, and Z coordinates and, depending on the acquisition method, may also include RGB color values, meaning that these points carry real-world geographic positions. In the case of a LiDAR survey, this point cloud is the primary “raw material.” Because it contains direct, real-world measurements, it serves as an ideal foundation for analysis, precise measurements, and archiving as a digital twin of reality. It is important to note that point clouds can also be generated through photogrammetry; however, in such workflows, the final product is often the mesh (triangulated surface) itself, meaning that the point cloud is less frequently used directly as an intermediate dataset.

A mesh, on the other hand, is a structured dataset derived from the point cloud. This already shows that it is derived data, meaning it contains calculated (rather than real) values. The processing software (in this case, Terra) uses specialized algorithms to connect neighboring points in the point cloud and create faces, which are connected through edges. This usually results in a network of triangles (a triangulated mesh), artificially creating a closed surface. There are no visual gaps in the rendered representation, making the result much easier for the average user to interpret. It is important to understand, however, that the values between the original (point cloud) points do not reflect reality. Instead, the software attempts to “guess” these intermediate values through mathematical calculations. The more complex an object is, the greater the likelihood that these calculations will be inaccurate. In photogrammetry, a mesh can be generated directly, but achieving a good result requires a large number of images (planned flight missions are the optimal approach). In the image above, the data acquisition was performed through manual flight, resulting in significant errors. However, many of the errors that are clearly visible in the relatively raw point cloud were concealed by the software in the mesh representation. In the image below, when viewed from a different angle, the missing areas become apparent.

This visualization method was further developed into the 3D Gaussian Splatting method. Its goal is the reconstruction of photorealistic scenes and the achievement of real-time synthesis from new viewpoints (novel-view synthesis). It describes the scene as a collection of a large number of differentiable 3D Gaussian functions (or “splats”), and this explicit representation enables fast optimization and rendering. How should these functions be imagined in space? We again start from the (raw) point cloud, but now we do not connect the points, rather we place a rotational ellipsoid on each individual point. The method assumes that the closer we are to a specific (surveyed) point, the more certain the information (e.g. color and opacity) is. Therefore, it does not separate the space between two points with definite edges, but with a smooth transition. We can see that, from the same dataset, we obtained a much nicer and more realistic image with 3DGS.

Copilot said:In general, this method is better suited for the visualization of thin objects as well as reflective surfaces.

Overall, from a visualization perspective, this type of representation is clearly superior. However, we should not forget that the “real” data itself does not change and does not become better if measurements or calculations need to be performed on it. This method only enables a different way of visualizing the data.